
We’ve created a new video tutorial to help you understand the AUO, its maps, score card and functionality.
Check it our here on our website here.
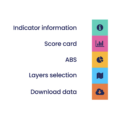
There are chapter headings in the progress bar to enable quick access relevant sections:
▪︎ Selecting your area and indicator
▪︎ Reading the Score card
▪︎ Indicator information (green tab)
▪︎ Score card tab (pink tab)
▪︎ ABS indicators (yellow tab)
▪︎ Layers selection (blue tab)
▪︎ Data downloads (orange tab)
▪︎ Double maps for comparison
▪︎ Book a demo
Our Director, Associate Professor Melanie Davern and Research Impact and Partnerships Manager Katherine Riggall Murray recently penned an article for the Planning Institute of Australia‘s Planning News magazine on using the AUO’s new 20 Minute Neighbourhood Scorecard to measure local liveability.
???? The PIA have kindly made it available for us to share.
Learn more about how 20 Minute Neighbourhood create more vibrant, healthy and sustainable communities and how you can use the AUO to support better understanding of local strengths and weaknesses as you plan for investment in liveability.
We are excited to share that our RMIT Centre for Urban Research team members Dr Lucy Gunn, Dr Alan Both, Dr Belen Zapata Diomedi, and RMIT AUO Director Dr Melanie Davern has been awarded a new strategic grant from The Australian Prevention Partnership Centre.
This new project will scale up our existing THAT Melbourne tool by developing a new Transport Health Assessment Tool for Brisbane (THAT-Brisbane).
The tool will evaluate the benefits of replacing short car trips with active transport for seven chronic diseases (ischaemic heart disease, stroke, diabetes type II, lung and colon cancers, and breast and uterine cancers in women).
You can see THAT Melbourne in action on the AUO website here.
And learn more about TAPPC’s strategic grants program to progress applied research into the prevention of chronic disease here.
Our RMIT Centre for Urban Research colleagues Nicola Willand and Trivess Moore respond to this important question in this weeks Conversation.
The required energy-efficiency rating of new housing in Australia will increase from 6 to 7 stars from October next year. Some claim this will greatly increase housing costs. But is this true?
Costs for new home owners are the sum of three things:
- capital costs to build the home
- costs to heat, cool and live in the home
- mortgage costs.
The focus has been on the upfront capital costs of new homes – over a million are expected to be built over the next three years. The costs of living in the home and impacts on mortgage payments are neglected. Given the move to 7 stars will cut energy use for heating and cooling by about 24%, the cost savings will outweigh any increase in mortgage repayments in many circumstances.
And there are simple ways to achieve a 7-star rating on a budget, as they explain.
Will 7-star housing really cost more? It depends, but you can keep costs down in a few simple ways
We’ve recently released 4 new disaggregated Social Infrastructure indicators:
• Health Infrastructure
• Cultural Infrastructure
• Education Infrastructure
• Community & Sport Infrastructure
As well as 2 new indicators measuring access to local GPs:
• Average distance to closest GP clinic
• Average distance to closest GP clinic with bulk-billing
All Social Infrastructure Indicators are available for FREE to all three levels of detail – for Local Government Areas, Suburbs and Neighbourhoods – through the Australian Urban Observatory.
We are delighted to share some of the new functionality now available through the RMIT Australian Urban Observatory.
New Decile Maps
We are delighted to share that users can now map 2021 indicator deciles within LGAs, Cities as well as for all similar geographic areas Nationally. You can change the way you view the deciles though the Layers Selection menu (the blue icon) in our AUO Score card. All three decile calculations can be viewed in the Indicator Information menu (the aqua icon) on the Score card.
Double Mapping Tool
Our new double maps allow for three kinds of indicator comparison:
• Comparing different indicators within the same city
• Comparing the same indicator across time within the same city
• Comparing the same indicator across cities
You can access our Double Mapping Tool through the user icon (the little person) located in the top left hand corner of the AUO. Click on ‘Change map mode‘ to switch between the different double map views.
Data Downloads
AUO indicator data downloads now available in a CSV format. Now you can use our data how and when you need it. You can access the downloads though the Data download menu (the orance icon) in our AUO Score card.
We’ve just updated our AUO Knowledge Sharing resource with links to recent reports, policies and tools including:
• Cardinia Shire’s Updated Liveability Plan
• The Australian Government’s State of the Environment Urban Chapter
• RMIT AUO / Victorian Government DELWP / City of Port Phillips’s 20 Minute Neighbourhood Scorecard
• And much much more!
Download via our website here.
In conjunction with the Victorian Government Department of Environment, Land, Water and Planning and City of Port Phillip, the Australian Urban Observatory has developed a new 20 Minute Neighbourhood Scorecard.
The scorecard is designed to assist local planners to understand areabased strengths and weaknesses as they plan for more locally connected and liveable communities and is based on liveability indicators currently available in the RMIT AUO.
You can download the AUO 20 Minute Neightbourhood Scorecard, and other useful guidance notes, via our website.
The Australian Government Department of Climate Change, Energy, the Environment and Water ‘State of the Environment 2021’ report paints a powerful picture of the impact of unsustainable development on our natural and lived environments.
The RMITAUO, alongside other important research by our RMIT Centre for Urban Research colleagues, has been used throughout the Urban Environments chapter to support understanding of liveability including:
• jobs
• food
• services
• public transport
• walking
• access to natural places
To read more about how urban environments influence our quality of life and affect the state of our natural environment access the ‘State of the Environment 2021’ Urban chapter here – https://lnkd.in/eaygHczv
We are delighted to share that the final report for our Bangkok Liveability Project – Measuring, monitoring and translating urban liveability in Bangkok – is now available for download.
Through this project, our team was able to develop knowledge of placed-based liveability in a rapidly urbanising low-to-middle income city. We were able to create a suite of 65 liveability indicators, all aligned to the UN Sustainable Development Goals, that can be applied across a range of contexts. We also created and shared capacity building resources and tools to support ongoing use of these indicators for other communities.
The project demonstrated that open source data can be used to create liveability indicators for Bangkok when local spatial data is not available, and a Spatial Urban Indicators Framework was developed enabling indicators to be updated over time.
To learn more about this project and read the final report click here.
This work was supported by the Victorian Health Promotion Foundation (VicHealth) under a Sustainable
Development Goals Partnership Grant.
Project partners were RMIT University’s Centre for Urban Research, Bangkok Metropolitan Administration, VicHealth, Victorian Government Department of Health and Human Services, and the United Nations Global Compact – Cities Programme.