
Photograph: David Crosling/AAP via The Guardian
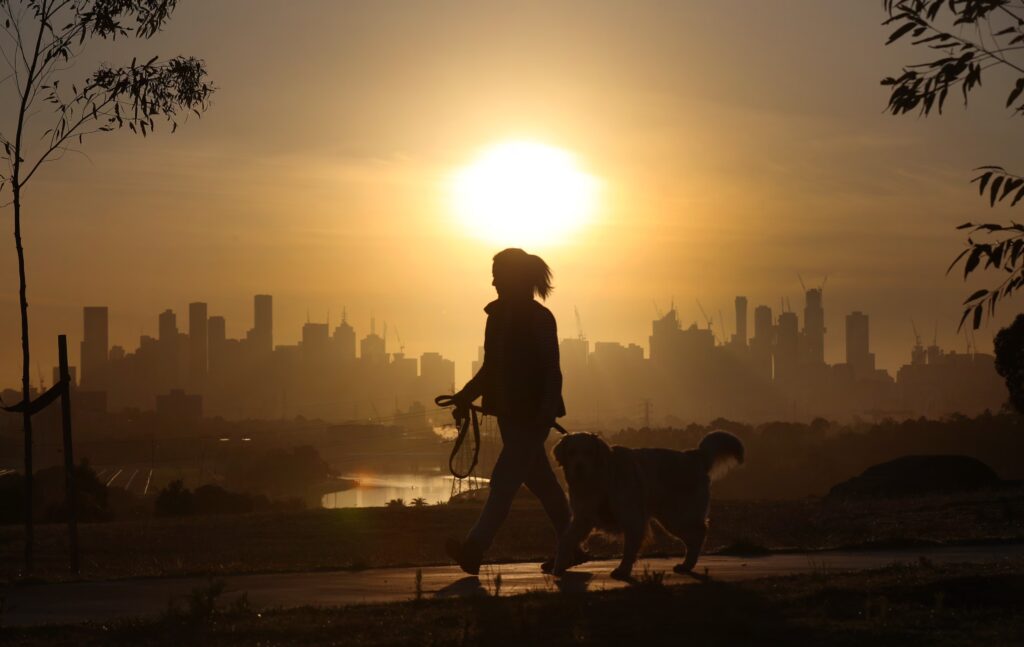
Extreme heat is one of Australia’s most dangerous natural hazards and it’s getting worse. As the federal government warns of rising heat-related deaths linked to climate change, our new national data reveals which neighbourhoods across Australia are most at risk and why.
A New Lens on Heat Risk
The Heat Vulnerability Index, developed by RMIT researchers, brings together a rich mix of datasets to paint a clear, suburb-by-suburb picture of heat risk across 21 major Australian cities.
This pioneering index combines:
Satellite land-surface temperature readings, revealing where heat builds and lingers.
Heat-sensitive population data, including very young children, older Australians, and people living with chronic health conditions or disabilities.
Socioeconomic factors like income and education, which shape a community’s ability to adapt and cool homes safely.
Built environment and green space measures, which affect how heat is absorbed and dissipated.
– Heat-sensitive population data, including very young children, older Australians, and people living with chronic health conditions or disabilities.
– Built environment and green space measures, which affect how heat is absorbed and dissipated.
– Socioeconomic factors like income and education, which shape a community’s ability to adapt and cool homes safely.
The result? A multi-layered map of risk that goes well beyond temperature alone.
What the Data Shows
The findings are striking:
– Western Sydney and Melbourne’s outer suburbs, including areas like Brimbank, record the highest vulnerability, amplified by limited tree cover and strong urban heat-island effects.
– Adelaide, Hobart, Launceston and Albury also contain surprising hot spots, proving heat risk is not confined to traditionally warm climates.
– Inner-city pockets such as Melbourne’s Carlton and Fitzroy and Sydney’s Woolloomooloo and Rushcutters Bay rank 5/5 for heat vulnerability. Even though these areas are relatively affluent, their built form and high proportion of older residents drive sensitivity.
Understanding Heat Sensitivity and Adaptive Capacity
The Heat Vulnerability Index is more than a single score.
It includes two key dimensions:
– Heat Sensitivity – How susceptible a community is to the effects of heat, based on age, health conditions, population density, and the local built environment.
– Adaptive Capability – A measure of how well people can respond, including the ability to afford cooling or access green space and community support.
These layers reveal that vulnerability is not solely about income. Wealthy neighbourhoods with a high concentration of elderly residents or poor building design can be just as exposed as lower-income suburbs.
Why It Matters for Cities and Policy
Heat is already a major health issue. Research shows that heatwaves caused more than 1,000 deaths in Australia between 2016 and 2019, with higher mortality in communities with older populations and lower incomes or education.
The AUO data underscores the urgency of integrated urban planning. Governments typically manage health, housing, environment and infrastructure separately. But extreme heat cuts across all these sectors, demanding coordinated action on:
– Urban greening and tree canopy expansion
– Cool building materials and design
– Access to affordable, reliable cooling and health services
“Planning is the major challenge,” says Associate Professor Qian (Chayn) Sun, who developed the index.
“We need an integrated approach to designing liveable, climate-resilient places.”
Explore the Heat Vulnerability Index
AUO’s interactive maps put this critical knowledge into everyone’s hands – planners, councils, researchers and communities. You can explore your neighbourhood’s heat vulnerability and adaptive capacity directly on our platform and use these insights to drive real, evidence-based action.
Discover the Heat Vulnerability Index and map your city today
Read the full article here.
About the Australian Urban Observatory
The Australian Urban Observatory, based at RMIT University’s Centre for Urban Research, translates complex urban data into accessible, map-based insights. By combining over 70 liveability indicators across nine domains, AUO supports healthier, fairer and more sustainable cities.