Meet our Newest Indicators!
With support from the Victorian Higher Education Investment Funding the Australian Urban Observatory (AUO) is excited to launch a new national resource of 24 new Specialist Housing Indicators that address critical housing issues across LGAs, suburbs and neighbourhoods of Australian cities.
The Specialist Housing Indicators have been developed to support our users with:
– directly addressing the current and critical housing issues of relevance to public policy and decision-making across Australia,
– piloting and demonstrating the value of small area spatial analysis, measurement and mapping of critical housing issues to help inform service planning, advocacy and policy intervention and
– Identifying areas of inequity with new specialist housing indicators available at the smallest level of geography available, dependent on data access and availability.
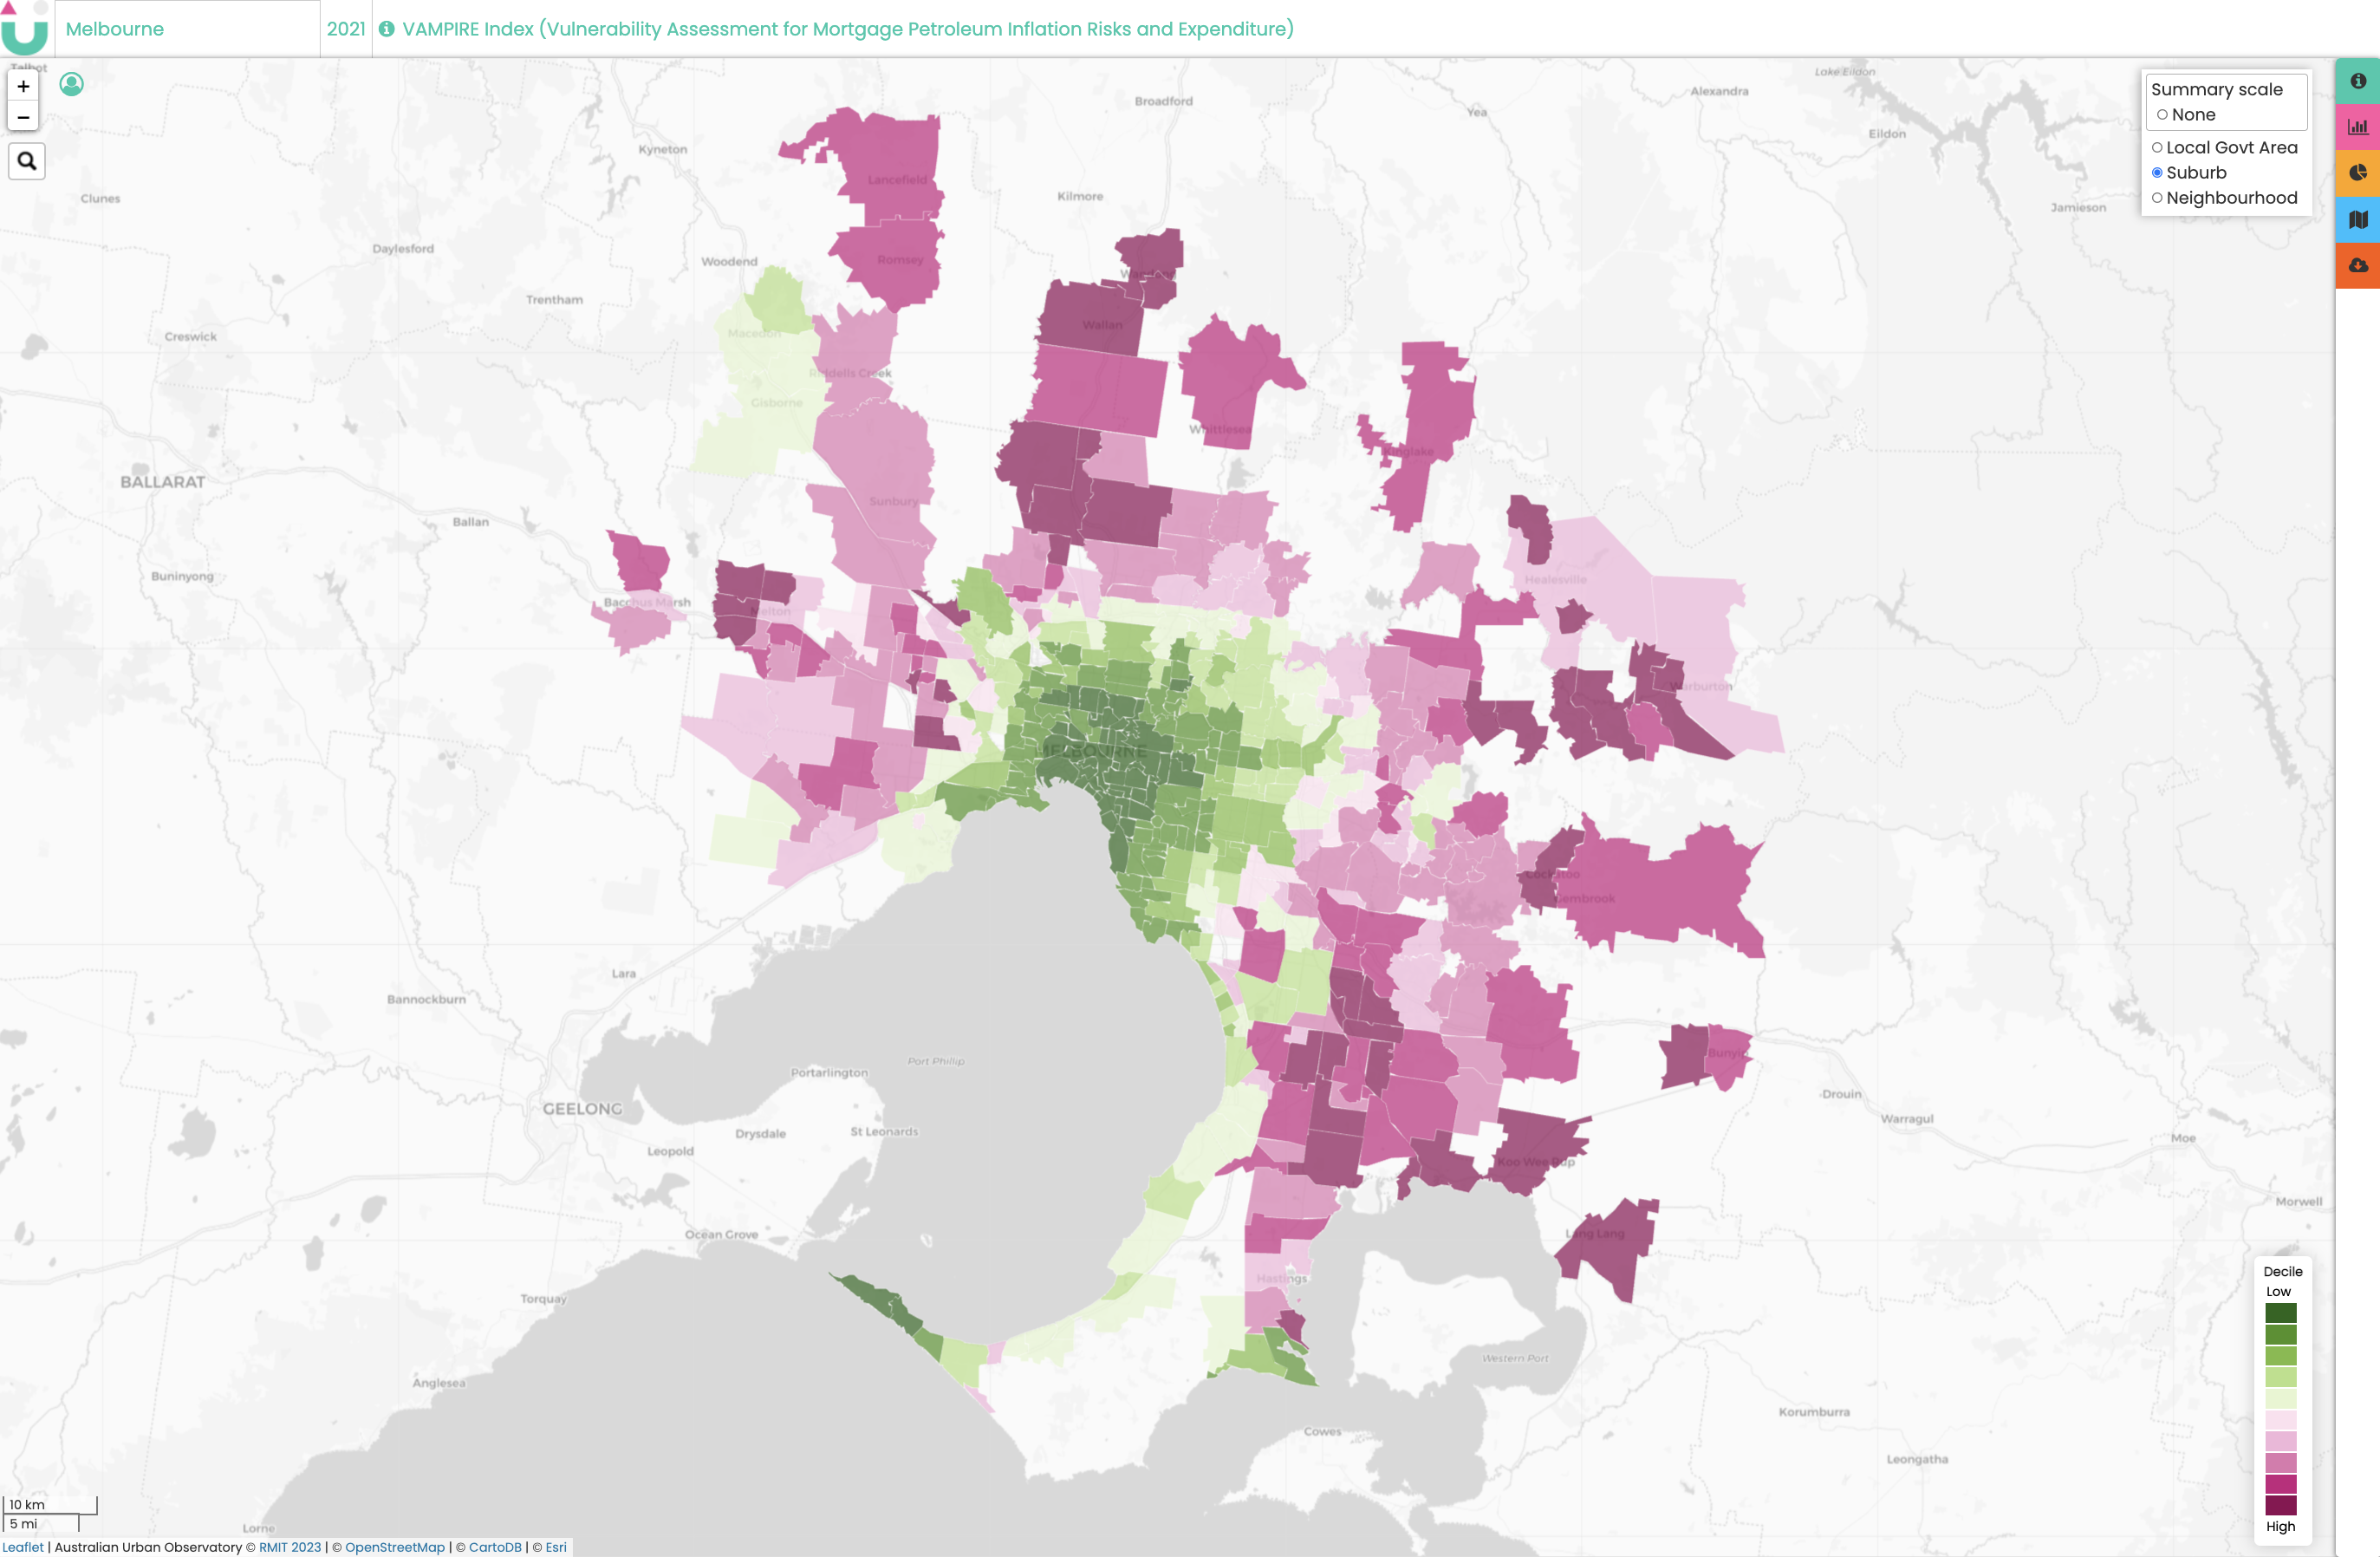
New specialist housing indicators include: housing precarity and gentrification, homelessness service access, VAMPIRE (Vulnerability Assessment for Mortgage, Petroleum, Inflation Risks and Expenditure, Key Workers, housing ownership and costs, social and public housing, and affordable rentals. Full details about all of the indicators and how they have been calculated can be found here.

How to Access the Indicators
The AUO maps 70+ indicators of liveability across Australia’s 21 largest cities. We map to three three levels of detail: Local Government Areas, Suburbs and Neighbourhoods for two time periods, 2018 and 2021. Understanding liveability indicators at this granular level enables partners to see where the inequities are in their community and supports planning and policymaking for community health and wellbeing.
All new Specialist Housing Indicators are FREE to access in the AUO. Indicators for our overall Liveability and Social Infrastructure domains are also available for FREE to all levels of detail.
Suburb and Neighbourhood levels of details for all other domains: Walkability, Transport, Food, Alcohol, Public Open Space, Employment and Housing are available via a paid partnership with the Australian Urban Observatory.
To learn more about liveability of Australian cities and a paid partnership with the Australian Urban Observatory, contact us here.
In conjunction with the Geography Teachers Association of Victoria we have developed some excellent new education resources to support understanding of liveability, urban connections, and geographies of wellbeing for Australian secondary school students.
These resources align with three specific units in the Victorian Geography Curriculum enabling students to explore:
Year 7: Place and Liveability
Factors that influence the decisions people make about where to live and their perceptions of the liveability of places, influence of accessibility to services and facilities; and environmental quality, on the liveability of places, environmental, economic and social measures used to evaluate places for their liveability, comparing two different places, influence of social connectedness and community identity on the liveability of places, strategies used to enhance the liveability of places, especially for young people.
Year 9: Geography of Interconnections
Perceptions people have of place, and how this influences their connections to different places, ways in which transportation technologies are used to connect people to services, information and people in other places and the effects of people’s travel, recreational, cultural or leisure choices on places, and the implications for the future of these places
Year 10: Geography of Human Wellbeing
Reasons and consequences for spatial variations in human wellbeing on a regional scale on a local scale in Australia, different ways of measuring and mapping human wellbeing and development, and how these can be applied to measure differences between places, role of initiatives by international and national government and non-government organisations to improve human wellbeing in Australia
We are excited to share these resources, alongside a supporting Teacher Resource, with teachers and students across Australia. They will be available through the AUO (download here) and GTAV websites.
We are excited to share our new Demographic Indicators to enable better understanding of equity of access to liveable places in your local community. These Demographic Indicators have been mapped with both 2016 and 2021 Census data providing alignment with our 2018 and 2021 Liveability Indicators.
In this first release, we have 115 Demographic Indicators mapped to all three levels of detail – LGAs, Suburbs and Neighbourhoods – including mapping of incidence of disease data which has been collected by the ABS Census for the first time in 2021.
The 115 new indicators include: Age and gender (24), Housing type (7), Diversity (6), SEIFA-IRSD (2), Labour force status (3), Income (5), Housing costs (15), Employment sector (5), Education (2) and Health (46).
You can download our most up to date list of AUO Cities and Indicators here.
National Treasure Magda Szubanski has taken a deep dive into chronic disease in Australia and what we can do to reduce its impact.
And where did she start?
By talking to our director, Associate Professor Melanie Davern, and learning about how where you live has a big impact on your health.
The RMIT AUO maps lived environment social determinants of health for Australia’s largest 21 cities. These social determinants can predict up to 50% of your health outcomes longterm.
And how can understanding these social determinants in your community help improve health and wellbeing for all? Magda says it so perfectly –
“If you have this information then you know what are the things that need to change in order to build the infrastructure so that people can have a healthier life!”
You can catch all three episodes on ABC iView here.
We’ve created a new video tutorial to help you understand the AUO, its maps, score card and functionality.
Check it our here on our website here.
There are chapter headings in the progress bar to enable quick access relevant sections:
▪︎ Selecting your area and indicator
▪︎ Reading the Score card
▪︎ Indicator information (green tab)
▪︎ Score card tab (pink tab)
▪︎ ABS indicators (yellow tab)
▪︎ Layers selection (blue tab)
▪︎ Data downloads (orange tab)
▪︎ Double maps for comparison
▪︎ Book a demo
Our Director, Associate Professor Melanie Davern and Research Impact and Partnerships Manager Katherine Riggall Murray recently penned an article for the Planning Institute of Australia‘s Planning News magazine on using the AUO’s new 20 Minute Neighbourhood Scorecard to measure local liveability.
???? The PIA have kindly made it available for us to share.
Learn more about how 20 Minute Neighbourhood create more vibrant, healthy and sustainable communities and how you can use the AUO to support better understanding of local strengths and weaknesses as you plan for investment in liveability.
We are excited to share that our RMIT Centre for Urban Research team members Dr Lucy Gunn, Dr Alan Both, Dr Belen Zapata Diomedi, and RMIT AUO Director Dr Melanie Davern has been awarded a new strategic grant from The Australian Prevention Partnership Centre.
This new project will scale up our existing THAT Melbourne tool by developing a new Transport Health Assessment Tool for Brisbane (THAT-Brisbane).
The tool will evaluate the benefits of replacing short car trips with active transport for seven chronic diseases (ischaemic heart disease, stroke, diabetes type II, lung and colon cancers, and breast and uterine cancers in women).
You can see THAT Melbourne in action on the AUO website here.
And learn more about TAPPC’s strategic grants program to progress applied research into the prevention of chronic disease here.
Our RMIT Centre for Urban Research colleagues Nicola Willand and Trivess Moore respond to this important question in this weeks Conversation.
The required energy-efficiency rating of new housing in Australia will increase from 6 to 7 stars from October next year. Some claim this will greatly increase housing costs. But is this true?
Costs for new home owners are the sum of three things:
- capital costs to build the home
- costs to heat, cool and live in the home
- mortgage costs.
The focus has been on the upfront capital costs of new homes – over a million are expected to be built over the next three years. The costs of living in the home and impacts on mortgage payments are neglected. Given the move to 7 stars will cut energy use for heating and cooling by about 24%, the cost savings will outweigh any increase in mortgage repayments in many circumstances.
And there are simple ways to achieve a 7-star rating on a budget, as they explain.
Will 7-star housing really cost more? It depends, but you can keep costs down in a few simple ways
We’ve recently released 4 new disaggregated Social Infrastructure indicators:
• Health Infrastructure
• Cultural Infrastructure
• Education Infrastructure
• Community & Sport Infrastructure
As well as 2 new indicators measuring access to local GPs:
• Average distance to closest GP clinic
• Average distance to closest GP clinic with bulk-billing
All Social Infrastructure Indicators are available for FREE to all three levels of detail – for Local Government Areas, Suburbs and Neighbourhoods – through the Australian Urban Observatory.
We are delighted to share some of the new functionality now available through the RMIT Australian Urban Observatory.
New Decile Maps
We are delighted to share that users can now map 2021 indicator deciles within LGAs, Cities as well as for all similar geographic areas Nationally. You can change the way you view the deciles though the Layers Selection menu (the blue icon) in our AUO Score card. All three decile calculations can be viewed in the Indicator Information menu (the aqua icon) on the Score card.
Double Mapping Tool
Our new double maps allow for three kinds of indicator comparison:
• Comparing different indicators within the same city
• Comparing the same indicator across time within the same city
• Comparing the same indicator across cities
You can access our Double Mapping Tool through the user icon (the little person) located in the top left hand corner of the AUO. Click on ‘Change map mode‘ to switch between the different double map views.
Data Downloads
AUO indicator data downloads now available in a CSV format. Now you can use our data how and when you need it. You can access the downloads though the Data download menu (the orance icon) in our AUO Score card.
